Interpret the results#
A candidate combines a departure time, weather model and routing objective. Rankings compare the candidates evaluated under the current settings. “Best” is relative to those candidates; it is not a safe-to-sail assessment or proof that every possible route has been examined.
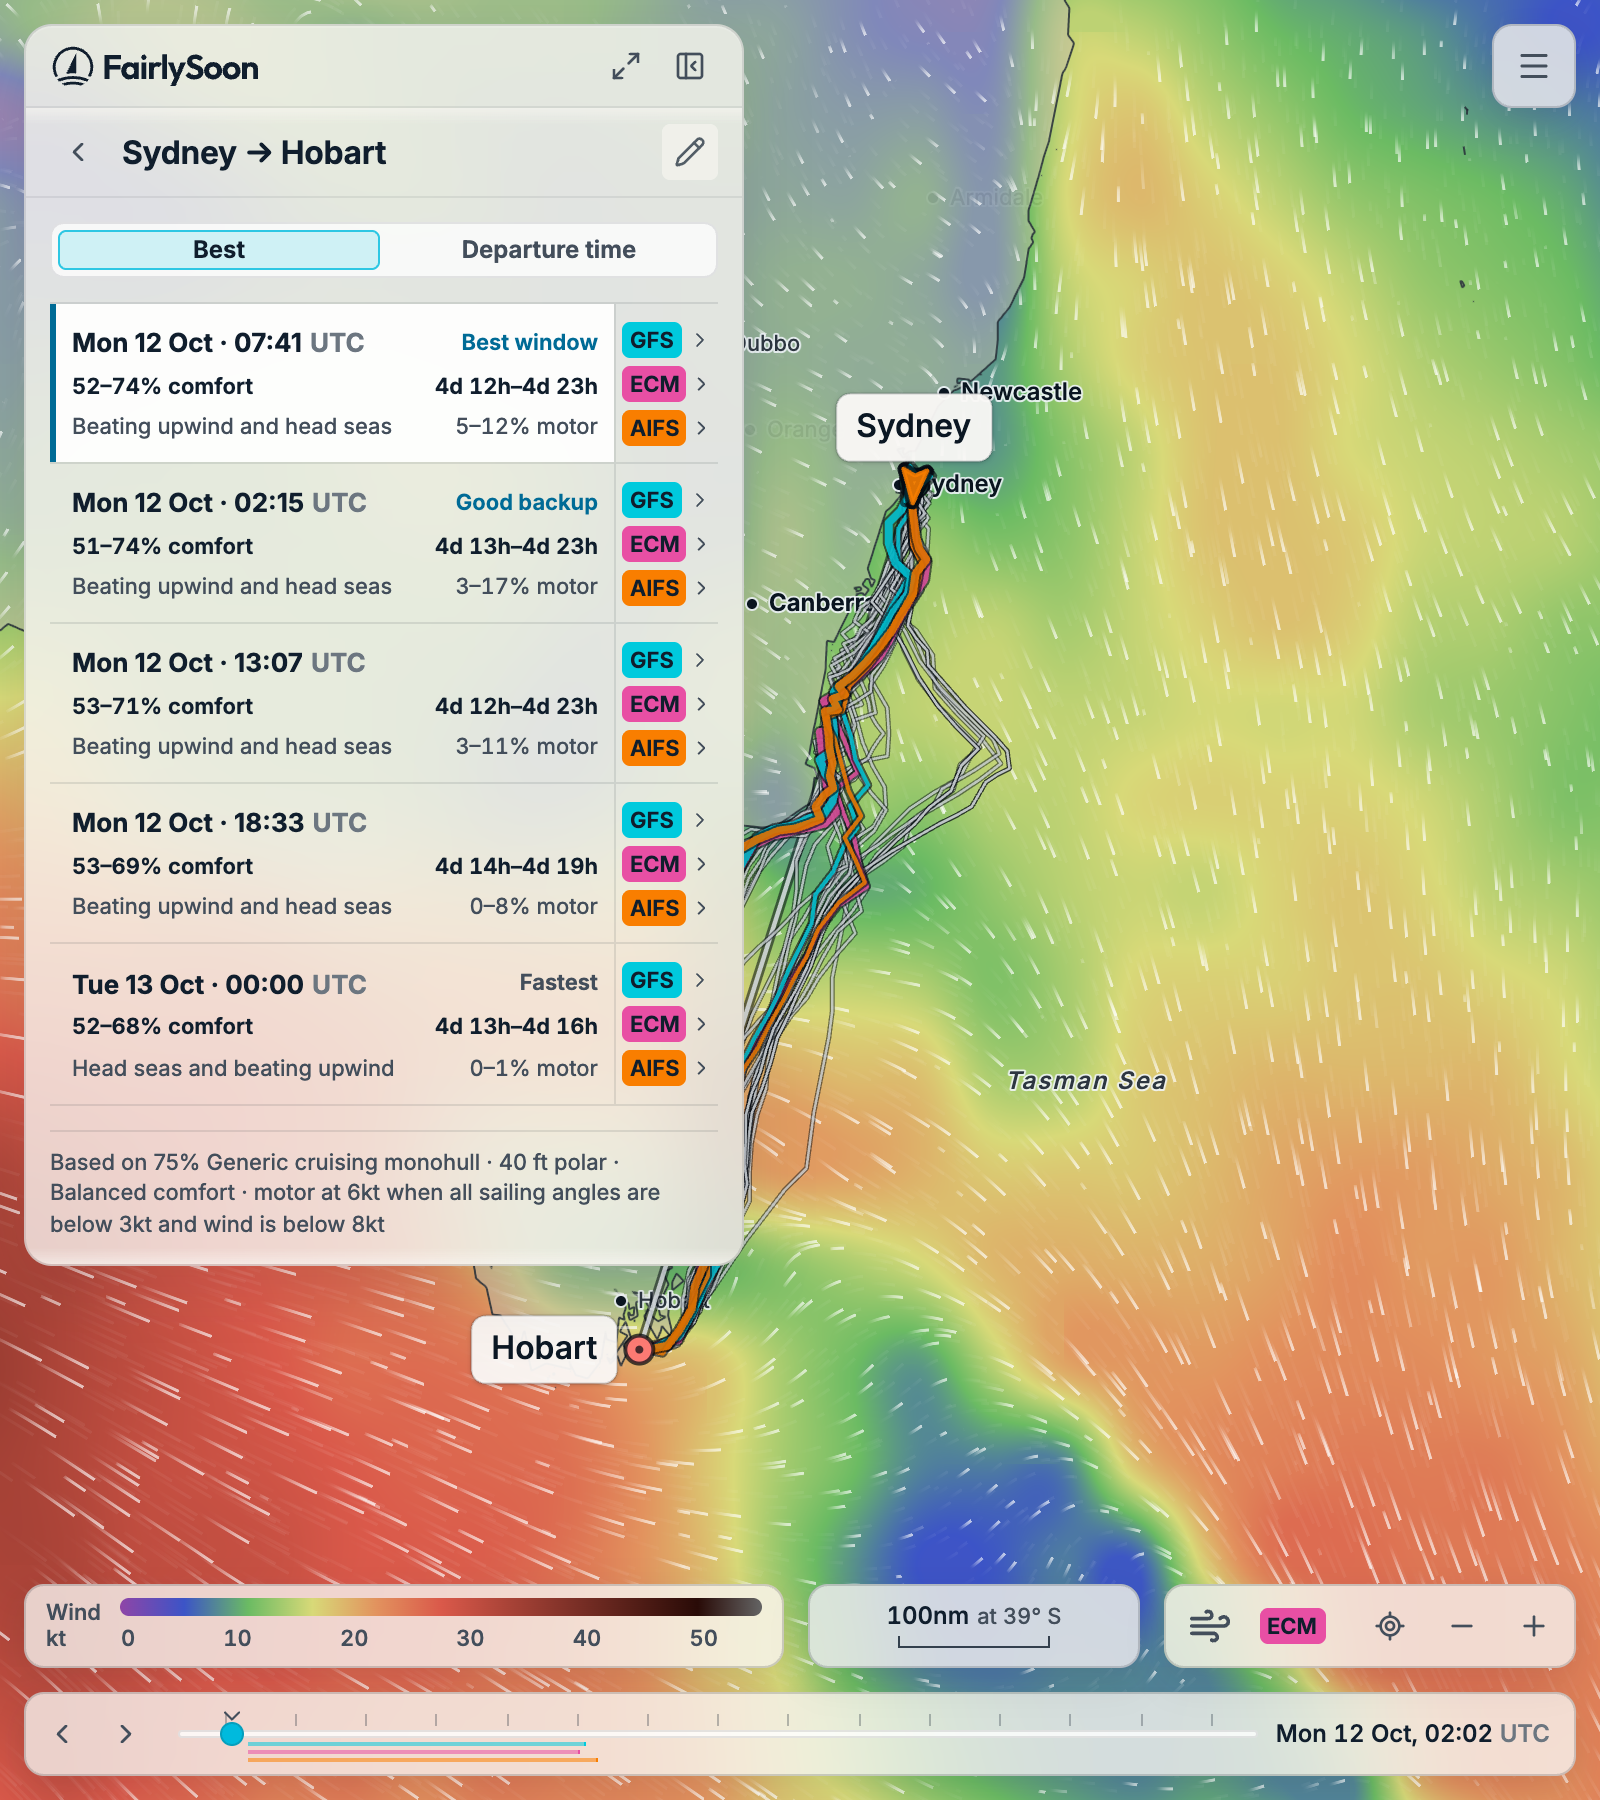
This worked example uses a saved forecast. The dates, routes and rankings illustrate how to read the screen; calculate again with current forecasts for your own passage.
Comfort is a relative score from 0 to 100, derived from the average discomfort along the calculated passage using your settings; higher is more comfortable. It is not a probability of safety. A percentage range shows the spread across the calculated alternatives. Inspect each selected model when they disagree. Recommendations use the least comfortable completed comfort route across the selected models. Below 50, departures remain available to inspect but receive no Best window or Good backup label; an unlabelled result is not an all-clear.
All departure, arrival and forecast times use your device’s timezone, not the departure port’s timezone. The zone appears beside the departure controls/results and in detailed timestamps. A range spanning a daylight-saving change shows both zone labels. Check your device timezone when planning a passage elsewhere.
Estimated arrival time depends on the boat’s predicted speed and the forecast encountered along the route. The passage profile follows the boat through time, so it differs from looking at the whole map at one forecast hour. Compare alternatives as well as the top result.
Compare departures side by side#
From the departure list, select Compare all departures, the expand button at the top of the sidebar. The full view puts each departure in its own column, with passage estimates above weather charts on shared axes.
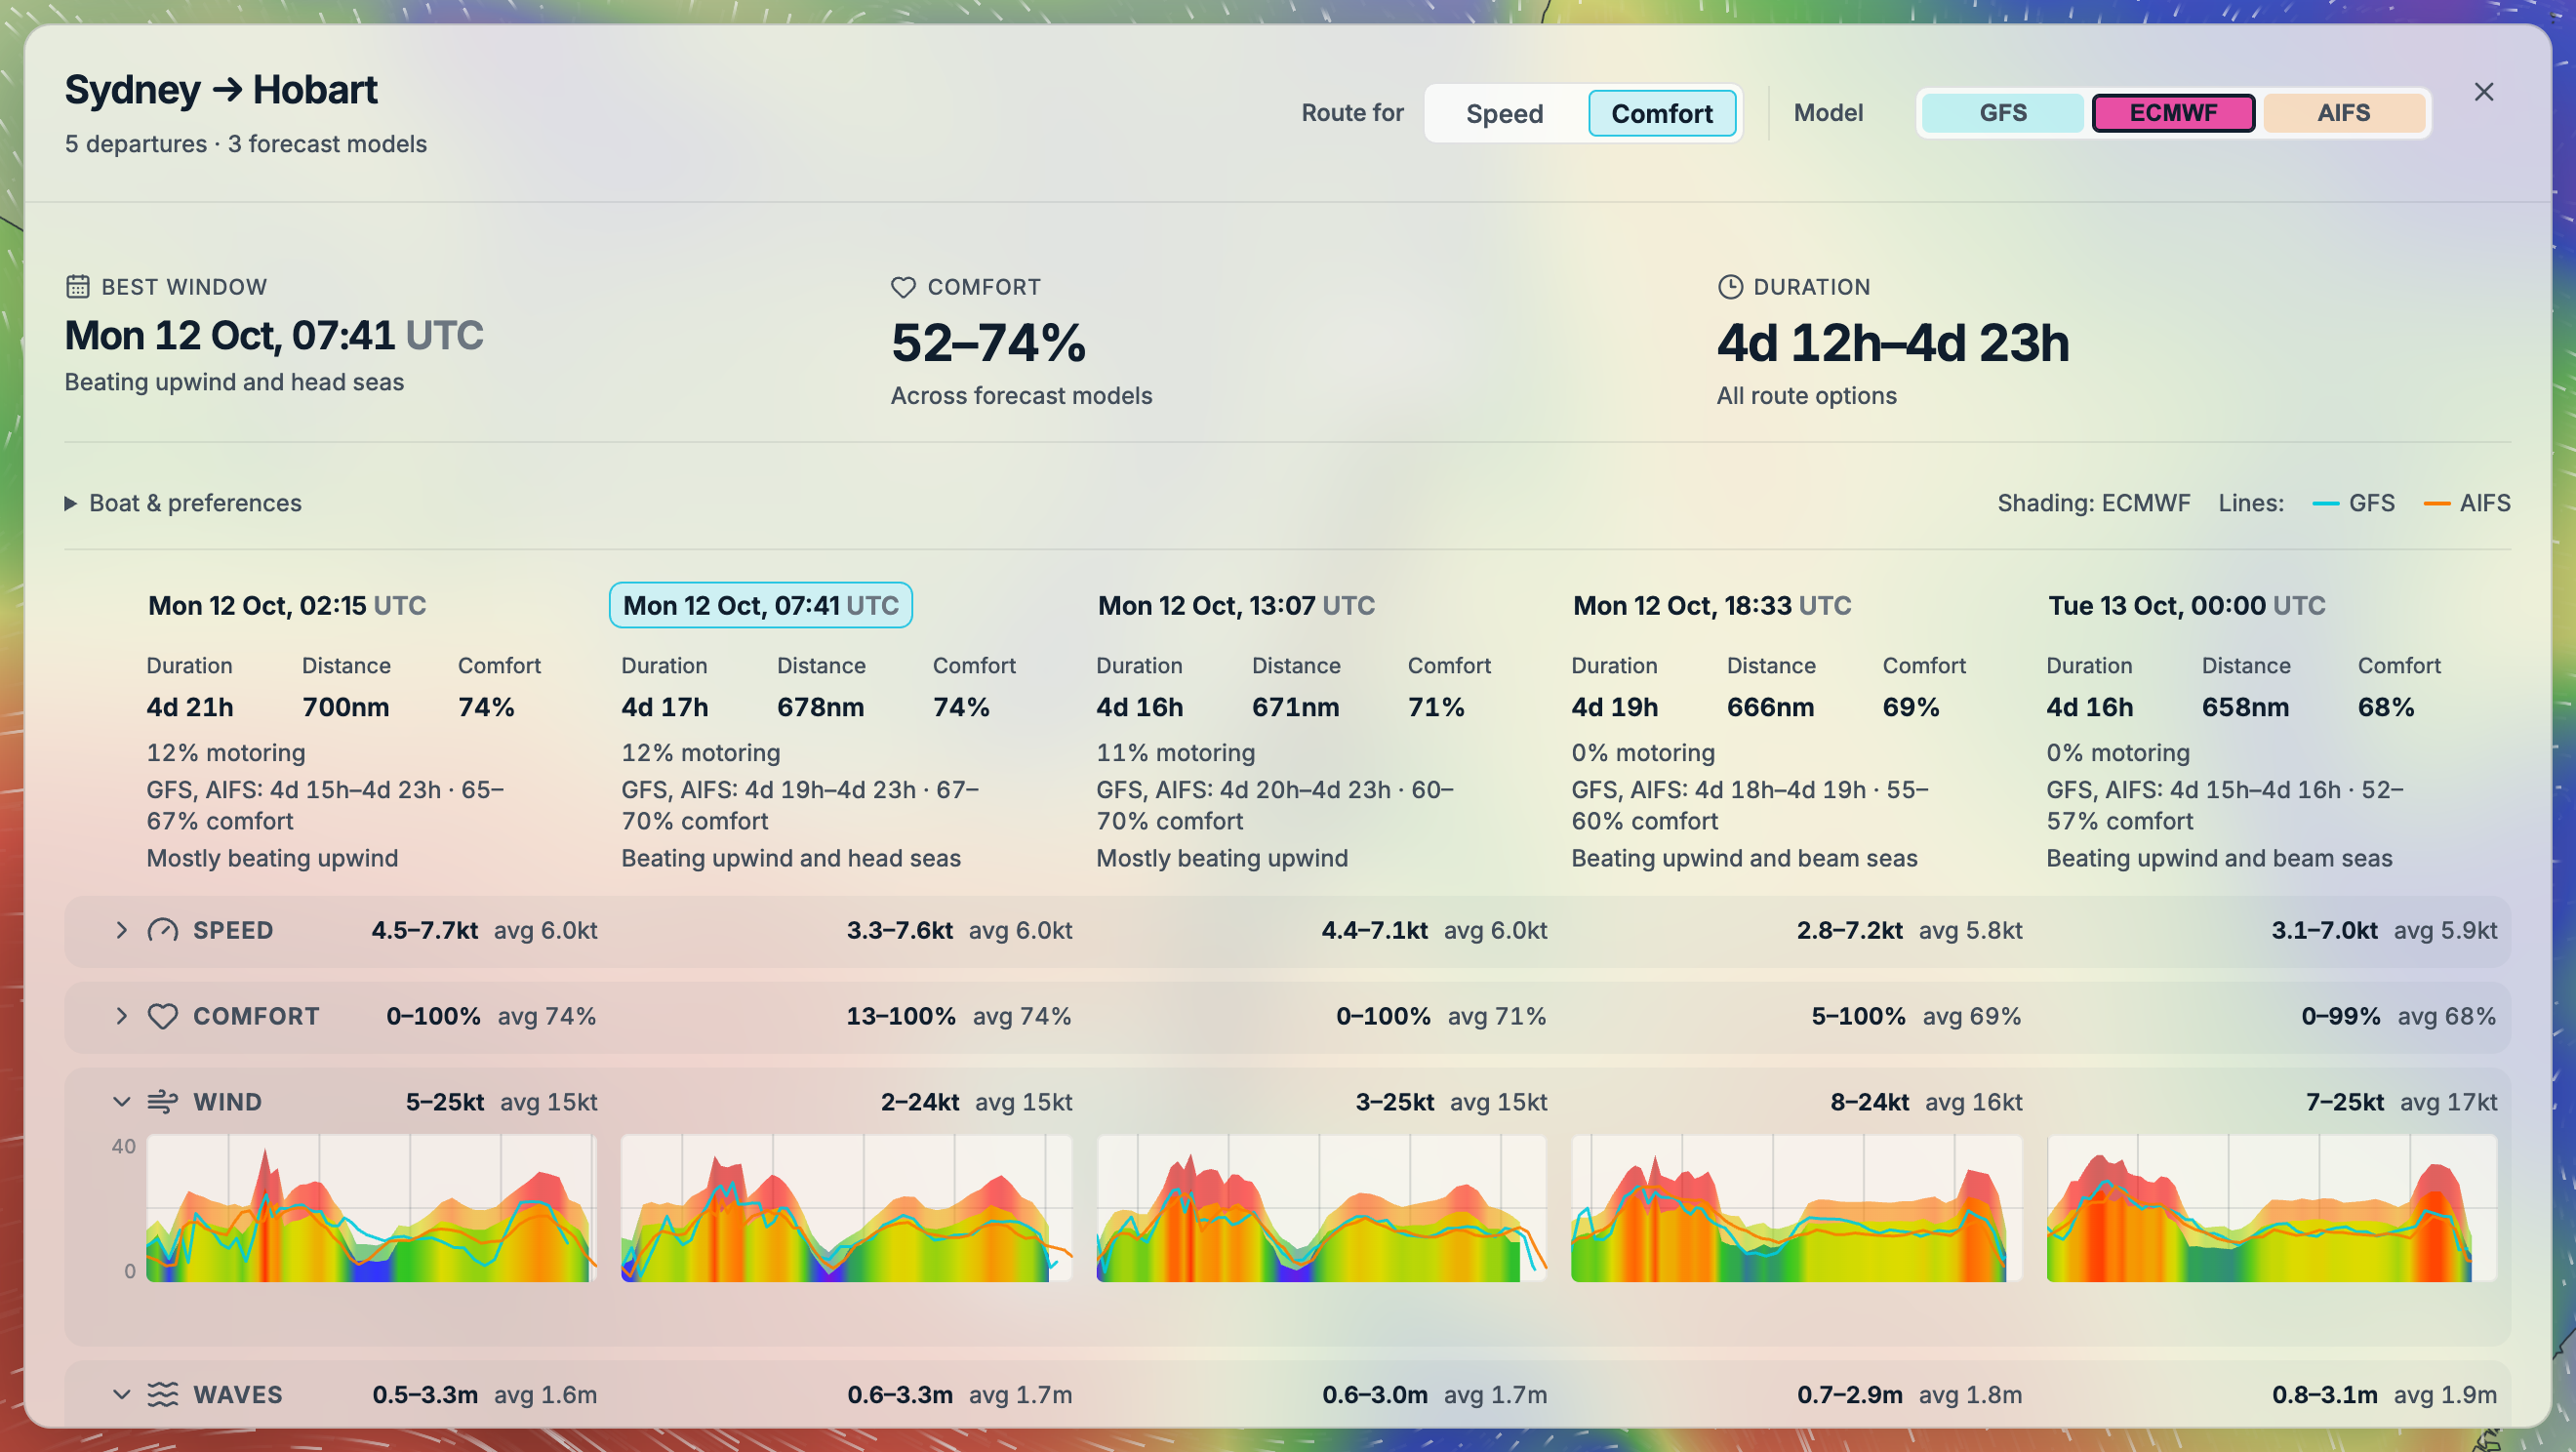
Use Comfort or Speed to compare the same kind of route across the departures. The selected Model supplies the shaded charts; coloured lines show the other models. The key above the columns identifies them. Compare duration and comfort first, then look down the charts for differences in wind and waves along each passage. Select a departure column to show its route on the map; close the full view to return to the departure list.
Compare models for one departure#
Choose a model button beside a departure in the results list, then select Open route analysis, the expand button in the conditions sidebar. The full view shows that model’s calculated passage, with arrival time, duration, distance, comfort and the conditions along the route.
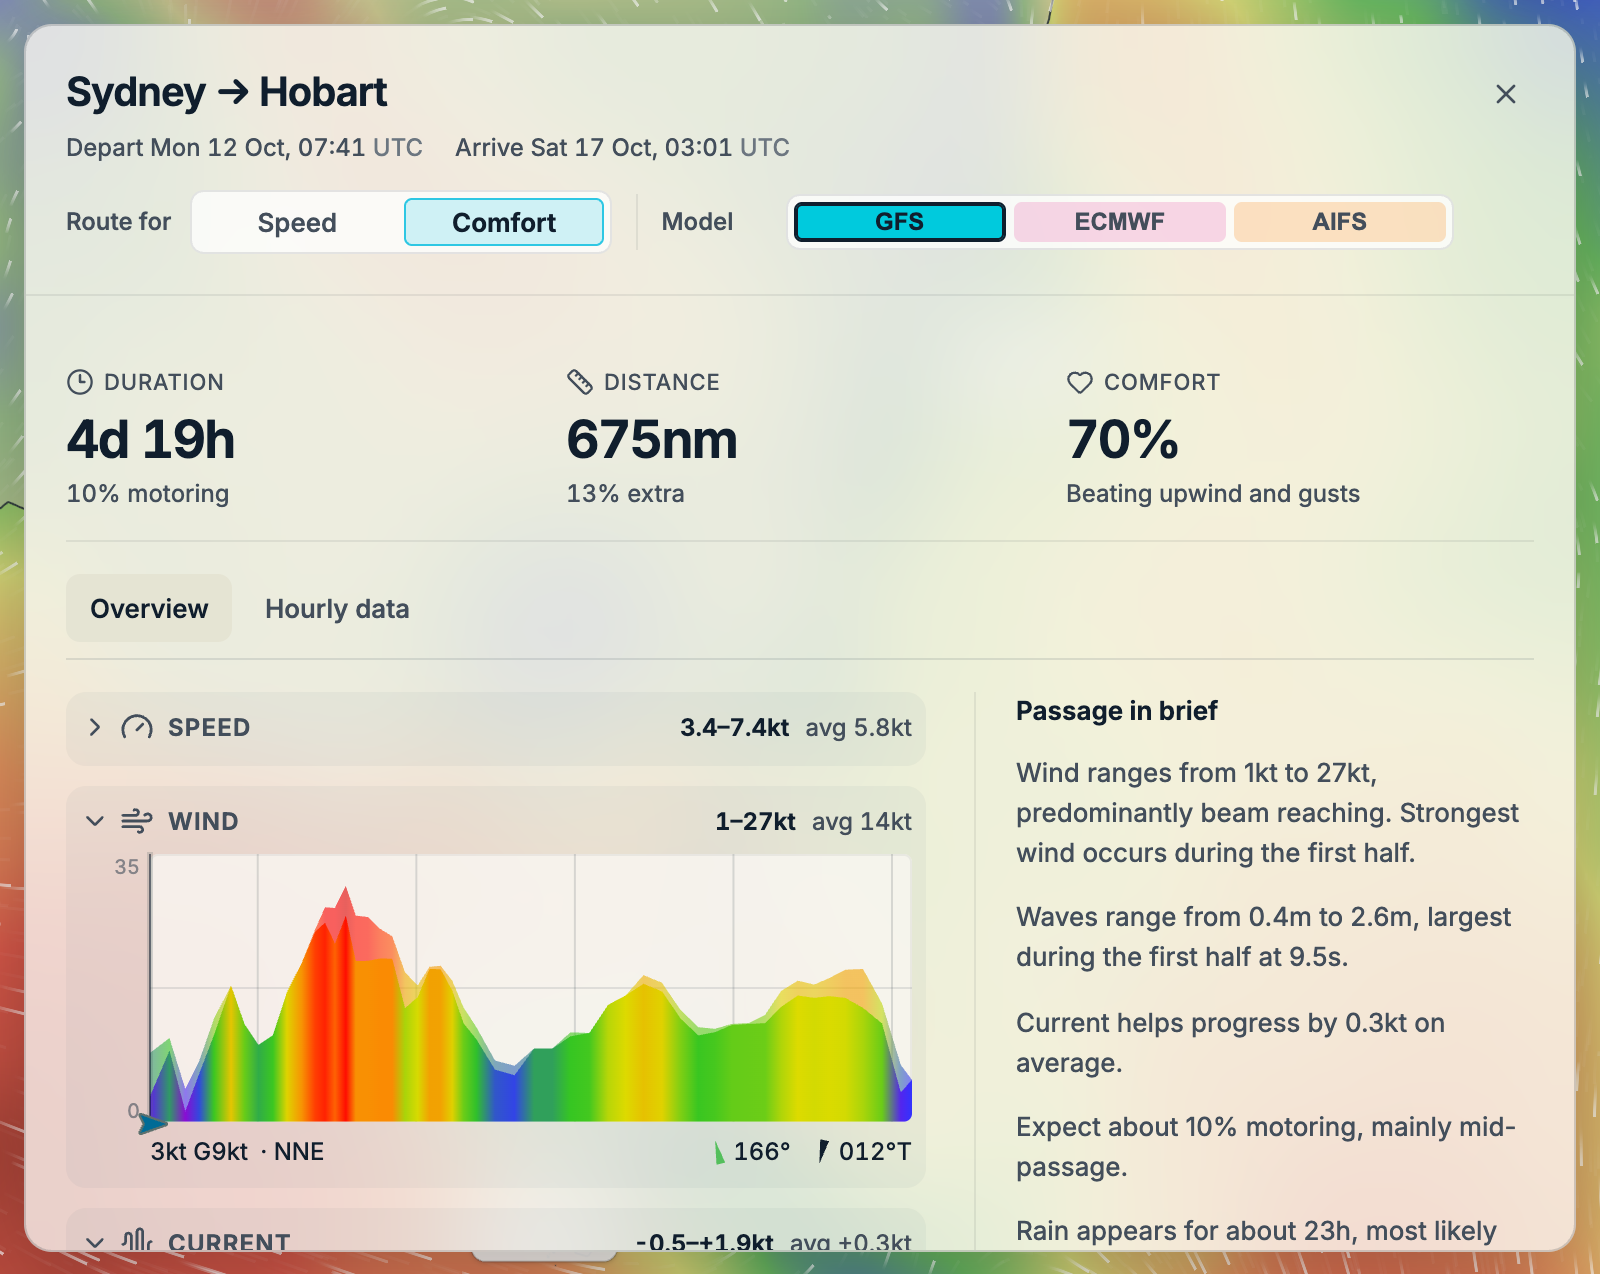
Keep the same departure and Comfort or Speed choice, then select GFS, ECMWF or AIFS at the top. The route, estimates, charts and Passage in brief update to that model’s calculation. This view shows one model at a time, so you can switch back and forth to compare them.
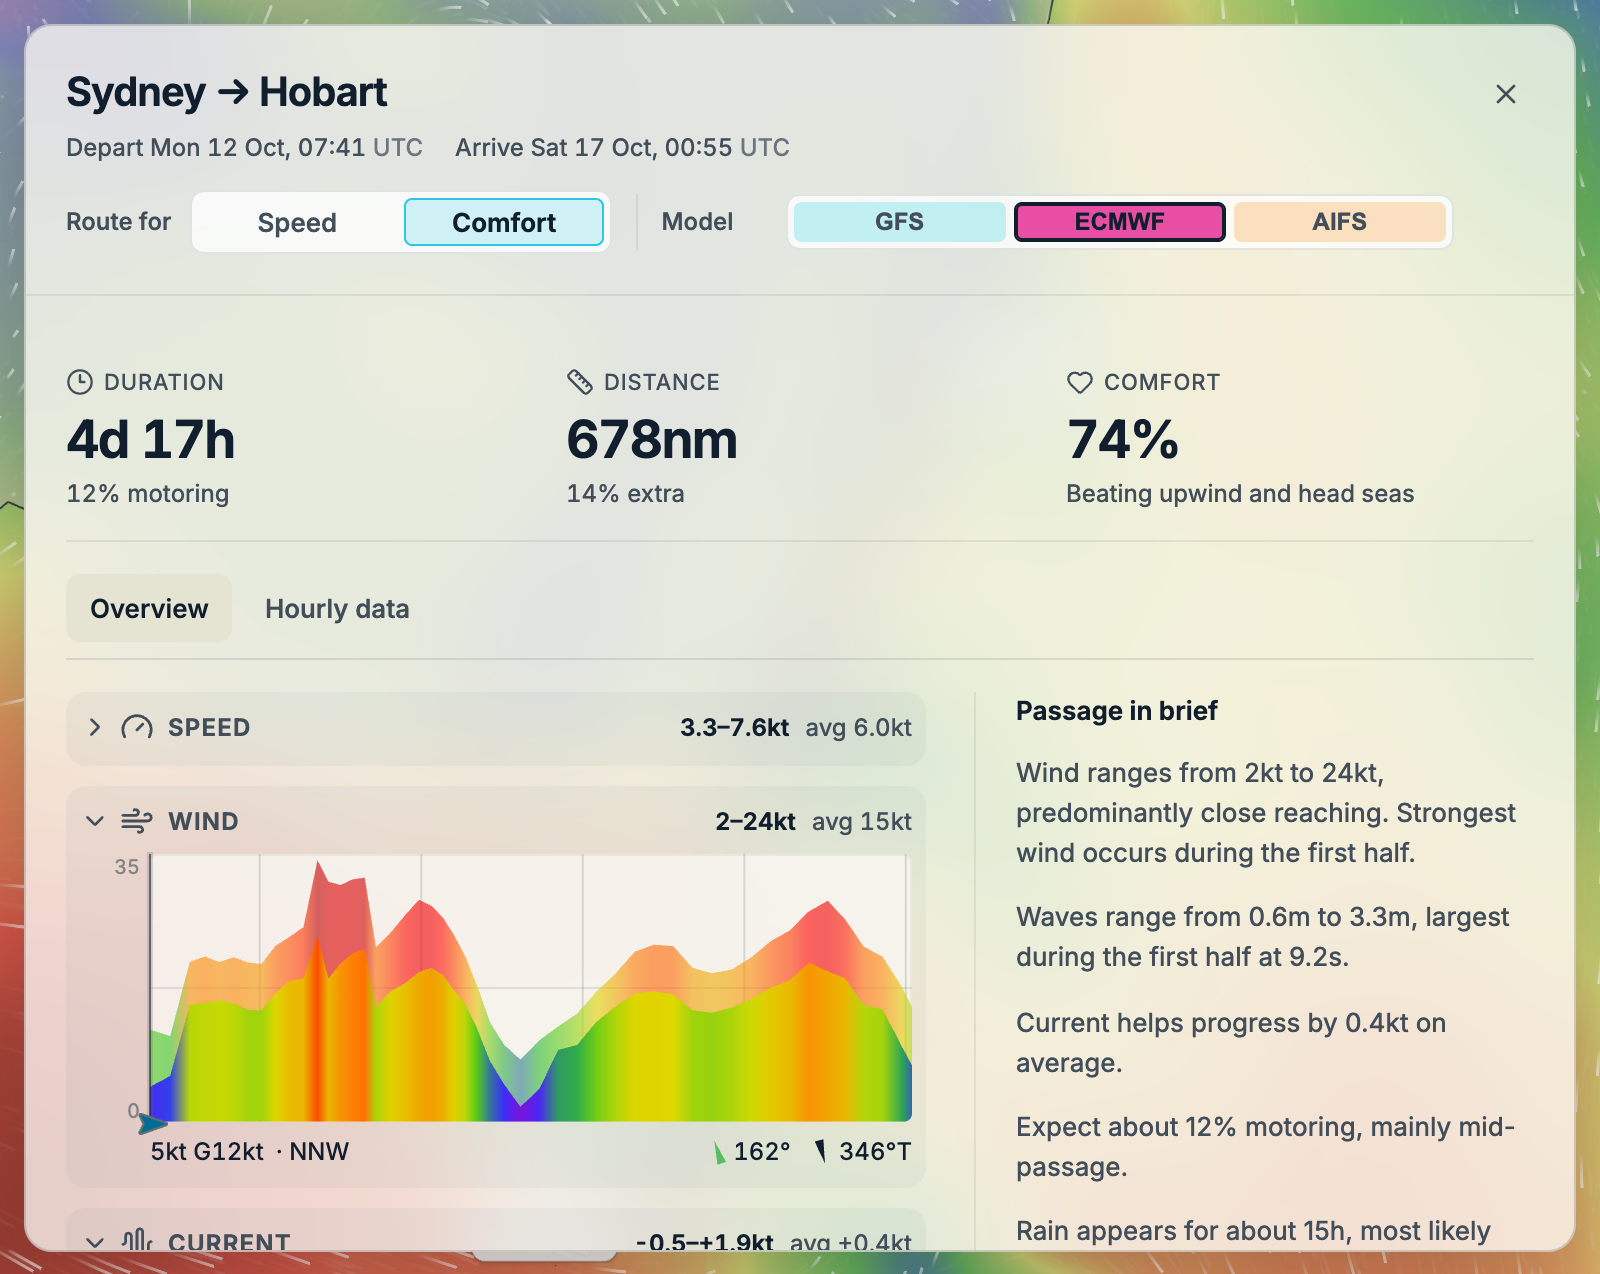
Look for differences in arrival time, stronger winds or larger waves, and where they occur during the passage. The Hourly data tab provides the values behind the charts when you want a closer look.
See Understanding the graphs for each graph’s colours, gust band, direction pointers and selected-time readings.
New forecast runs, different departure times and changes to boat or comfort settings can change the route and estimated arrival. Small differences may build up over a long passage. Recheck the plan close to departure.
Which forecasts affect the calculation?#
Wind, your boat's polar and currents drive the movement calculation. Comfort also accounts for wind strength and angle, gustiness, waves, rain, atmospheric instability and lightning probability where available.
See How comfort is calculated for the input breakdown, how the three comfort settings differ, and which layers are shown only for inspection. The map layer you display does not choose the solver's inputs.
Refine boat and comfort settings, or inspect the weather behind the results.